Install and Secure Netdata on Synology NAS with DSM Reverse Proxy
Learn how to install and configure Netdata on Synology NAS using Docker Compose. This guide covers custom settings, DSM reverse proxy configuration, IP-based access control, and network security for a private, real-time monitoring dashboard.
Introduction: Monitor Your NAS Like a Pro
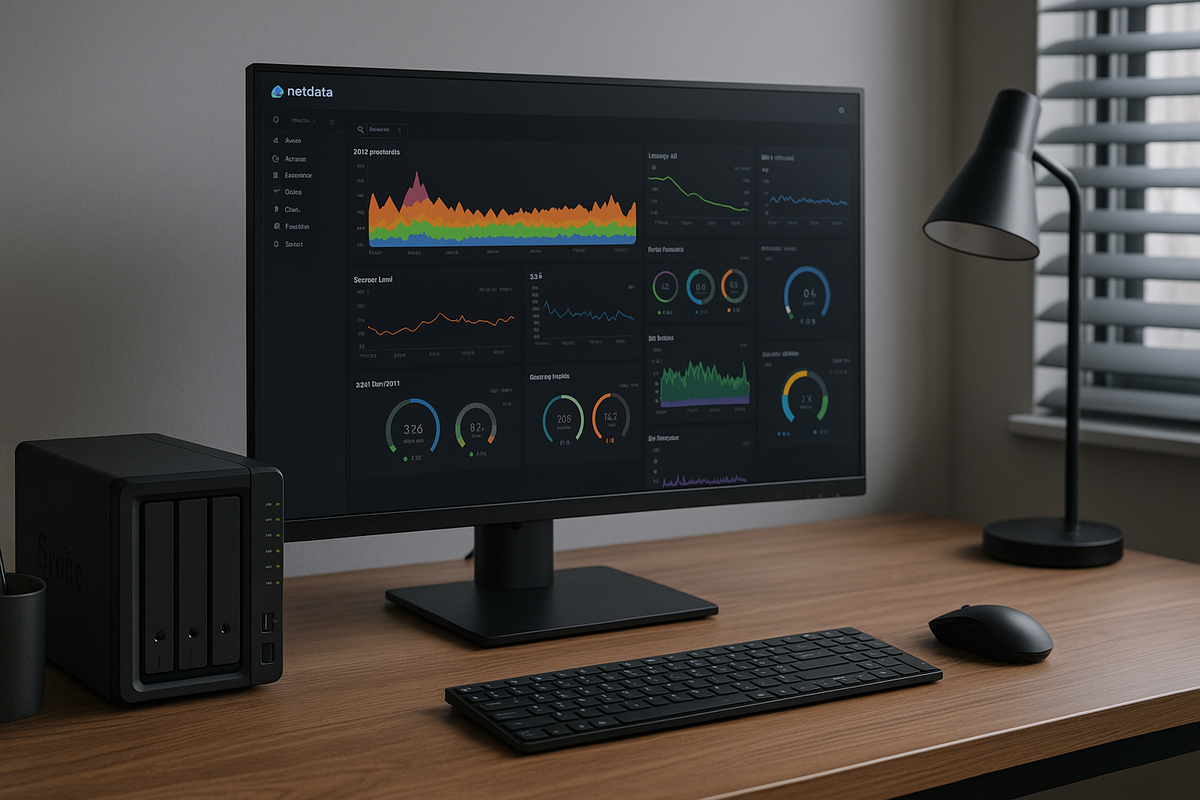
When running multiple Docker containers, servers, or media processes on your Synology NAS, keeping track of performance in real time is crucial. Netdata is a powerful open-source monitoring tool that provides stunning, interactive dashboards showing CPU, RAM, I/O, network, and container metrics — updating every second.
Unlike traditional monitoring systems, Netdata is lightweight, automatic, and highly visual, making it perfect for home servers and professionals alike.
In this complete guide, we’ll cover how to:
- Deploy Netdata with Docker Compose
- Enable persistent storage and custom configs
- Secure Netdata via DSM’s built-in Reverse Proxy
- Apply IP-based Access Control Profiles for restricted access
- Harden your setup with advanced network and security options
By the end, you’ll have a professional-grade monitoring dashboard accessible via a secure domain, like https://monitor.example.com.
Step 1: Folder Structure
Create a clean directory for Netdata inside your NAS:
/volume1/docker/netdata/
│
├── docker-compose.yml
├── config/
├── charts.d/
└── netdatadata/
config/→ for custom configurationscharts.d/→ optional scripts or pluginsnetdatadata/→ persistent runtime datadocker-compose.yml→ main deployment file
💡 Tip: Organizing this way ensures all your configurations and logs survive container updates or re-deployments.
Step 2: Docker Compose File
Create docker-compose.yml inside /volume1/docker/netdata/:
services:
  netdata:
    image: netdata/netdata:latest
    container_name: netdata
    hostname: synology-nas
    ports:
      - "19999:19999"
      # - "127.0.0.1:19999:19999"
    restart: unless-stopped
    cap_add:
      - SYS_PTRACE
    security_opt:
      - apparmor:unconfined
    volumes:
      - ./netdatadata:/var/lib/netdata
      - /etc/passwd:/host/etc/passwd:ro
      - /etc/group:/host/etc/group:ro
      - /proc:/host/proc:ro
      - /sys:/host/sys:ro
      ## Snology NAS doesn't have os-release ##
      # - /etc/os-release:/host/etc/os-release:ro
      - /var/run/docker.sock:/var/run/docker.sock:ro
      - ./config:/etc/netdata:rw
      - ./charts.d:/usr/libexec/netdata/charts.d:rw
    environment:
      - TZ=Asia/Seoul
      - DO_NOT_TRACK=1
Step 3: Understanding Each Section
Image and Hostname
image: netdata/netdata:latest
hostname: synology-nas
The official Netdata image automatically configures system monitoring.
The hostname appears on your dashboard and helps differentiate multiple monitored nodes.
Port Mapping
ports:
  - "19999:19999"
Port 19999 is Netdata’s default HTTP port. For now, we’ll expose it directly so you can test and verify that the dashboard is running properly by visiting http://your-nas-ip:19999.
However, once you confirm that Netdata works correctly and finish setting up the DSM Reverse Proxy, you should update this mapping to:
ports:
  - "127.0.0.1:19999:19999"
This binds Netdata’s port only to the NAS’s local interface (localhost) — meaning it can no longer be accessed from the external network.
All access will instead go through DSM’s reverse proxy, which provides HTTPS encryption and IP-based access control.
In short:
- Now:
19999:19999→ for initial setup and testing. - Later:
127.0.0.1:19999:19999→ for production, secure local binding through DSM reverse proxy.
Security & Capabilities
cap_add:
  - SYS_PTRACE
security_opt:
  - apparmor:unconfined
Netdata needs these to read system metrics safely (no root-level risk).
Volume Mounts
| Host Path | Container Path | Purpose |
|---|---|---|
./netdatadata | /var/lib/netdata | Stores persistent runtime data |
/var/run/docker.sock | /var/run/docker.sock | Monitors Docker containers |
./config | /etc/netdata | Optional: custom configs |
/proc, /sys | /host/proc, /host/sys | Reads hardware metrics |
Environment Variables
| Variable | Description |
|---|---|
TZ | Local timezone |
DO_NOT_TRACK | Disable anonymous telemetry for privacy |
Step 4: Deploy Netdata
Run the container via SSH or DSM’s Docker Compose interface:
cd /volume1/docker/netdata
docker compose up -d
Then visit:
http://your-nas-ip:19999
If you plan to use Netdata Cloud later, you can sign in from the login panel on the right.
However, since we’re running Netdata locally for now, simply click “Skip and use the dashboard anonymously.” at the bottom right corner to access your dashboard directly.
You’ll see your Netdata dashboard — live metrics updating in real time.
Step 5: Configure DSM Reverse Proxy
Since Netdata doesn’t support built-in login authentication, we’ll secure it using DSM’s Reverse Proxy + Access Control Profile system.
This method gives you:
- Encrypted HTTPS access
- Restriction by IP address
- Option to assign an SSL certificate
5.1 Create a Domain
Make sure your domain (or Synology DDNS) points to your NAS IP.
Example:monitor.example.com → NAS public IP
5.2 Create Reverse Proxy Entry
Go to:
Control Panel → Login Portal → Advanced → Reverse Proxy → Create
Set these parameters:
| Setting | Value |
|---|---|
| Description | Netdata |
| Source Protocol | HTTPS |
| Hostname | monitor.example.com |
| Port | 443 |
| Destination Protocol | HTTP |
| Hostname | localhost |
| Port | 19999 |
✅ Enable HSTS and HTTP/2
✅ Click OK
This creates a secure HTTPS route for Netdata.
5.3 Assign SSL Certificate
Go to:
Control Panel → Security → Certificate
Add or use an existing Let’s Encrypt certificate for monitor.example.com.
Then:
- Click Settings
- Assign the certificate to your new reverse proxy entry
🔒 Tip: DSM automatically renews Let’s Encrypt certificates every 90 days.
Step 6: Restrict Access via DSM Access Control Profile
Netdata doesn’t offer ID/password authentication — so we’ll restrict who can connect based on IP address.
This method is secure, simple, and managed directly in DSM.
6.1 Check Your Current Computer’s IP
- On your local computer, visit:
👉 https://whatismyipaddress.com
or search “my IP” on Google. - Note your public IP address, e.g.
123.123.123.123.
6.2 Create an Access Control Profile
In DSM:
- Go to Control Panel → Login Portal → Advanced → Access Control Profile
- Click Create
- Name it something like Netdata-Access
- Select Allow access only from these IP addresses
- Add your own public IP address (e.g.,
123.123.123.123) — this is the computer you’ll use to access Netdata - Optionally, add other trusted IPs (for example, your office or VPN subnet)
- Finally, add the rule:
0.0.0.0/0, denyat the end.
This denies access from all other IP addresses, ensuring only the ones explicitly listed above can connect. - Click OK to save the profile
🔒 Important: Adding 0.0.0.0/0, deny acts as a global block for any unspecified IP, which is crucial for preventing unauthorized access from the public internet.6.3 Apply the Access Control Profile
Now link it to your Netdata Reverse Proxy:
- Go to Control Panel → Login Portal → Advanced → Reverse Proxy
- Select your Netdata rule (
monitor.example.com) - Click Edit
- Open the Access Control Profile dropdown
- Select Netdata-Access
- Apply changes
✅ Done — now only your authorized IP(s) can access the dashboard.
⚙️ You can later expand the IP list to include your office, VPN subnet, or home network.
6.4 Test Your Configuration
From your authorized computer:
https://monitor.example.com
✅ You should see the dashboard.
From another (unauthorized) network:
🚫 DSM will block access automatically — no login prompt, no exposure.
Step 7: (Optional) Enable IP Restriction + Cloudflare Edge Layer
If you’re routing your domain through Cloudflare, combine DSM’s Access Profile with Cloudflare IP Access Rules.
This double layer ensures:
- Global CDN protection
- DDoS mitigation
- Geolocation restrictions (e.g., only allow Korea or your home country)
Step 8: (Optional) Customize Netdata Configuration
You can export default configs for deeper tuning.
docker exec -it netdata bash
cd /etc/netdata
cp -r /usr/lib/netdata/conf.d/* .
exit
Then edit files under your mounted config folder, e.g.:
/volume1/docker/netdata/config/netdata.conf
Useful options:
- Change data retention
- Disable unused plugins
- Adjust update intervals
Step 9: Hardening Security
To keep your NAS safe, follow these best practices:
- Restrict Port 19999
- DSM → Control Panel → Security → Firewall
- Deny all external access to port
19999.
- Auto Block Unauthorized Attempts
- Enable Auto Block under DSM Security.
- Use VPN Access
- Limit monitoring access to VPN users only (Synology VPN Server or Tailscale).
- Backups
- Regularly back up your
/docker/netdata/folder for persistent data and configs.
- Regularly back up your
Step 10: Verifying Your Setup
To confirm your configuration:
- ✅ HTTPS works
- ✅ Access limited to your IP(s)
- ✅ Firewall blocks direct port 19999
- ✅ Netdata shows live metrics
You now have a secure and private monitoring dashboard fully integrated with DSM.
Troubleshooting
| Issue | Cause | Fix |
|---|---|---|
| Can’t access dashboard | IP not whitelisted | Add current IP to Access Control Profile |
| SSL errors | Certificate mismatch | Reassign correct certificate |
| Charts not showing Docker stats | Missing volume /var/run/docker.sock | Verify Docker socket mount |
| High CPU usage | Too frequent updates | Adjust update every in config |
| Access denied via VPN | VPN IP not listed | Add VPN subnet to access profile |
FAQs
Q1. Why doesn’t Netdata have login authentication?
Netdata’s local dashboard is designed for internal networks. Authentication is handled via proxy or firewall rules — like DSM’s Access Control.
Q2. Can I use DSM 2FA protection?
Yes — indirectly. DSM’s Access Profile and certificate systems inherit DSM’s authentication policies.
Q3. Is it safe to expose Netdata via HTTPS?
Yes, if access is restricted by IP and SSL is enabled. Never expose port 19999 directly to the internet.
Q4. How do I update Netdata?
docker compose pull
docker compose up -d
Q5. Can I connect multiple NAS devices to one dashboard?
Yes. You can stream data between nodes or use Netdata Cloud for unified visualization.
Q6. What if my home IP changes?
Use a Dynamic DNS or a VPN to maintain secure, consistent access.
Conclusion
Setting up Netdata on Synology DSM gives you deep visibility into your system’s performance — CPU, RAM, I/O, network, containers, and more — all in real time.
By combining Docker Compose deployment, DSM Reverse Proxy, and Access Control Profiles, you achieve enterprise-level monitoring with airtight security.
Even though Netdata lacks native login authentication, DSM’s IP-based protection makes it just as secure and flexible. Whether you’re a home server enthusiast or a professional admin, this setup offers reliability, privacy, and power — all in one elegant dashboard.
External Reference:
📘 Official Netdata Documentation